Your device measures something — a temperature, a humidity, a level — and you want to read it on your phone, now and over the day. This page takes a sensor from the sketch to a gauge and a chart on your dashboard, in three steps, with the complete sketch at the end.
How it works
Your device writes a value to an address — I1, like A0. In the app, that address is a signal: it has a name, a unit, and a history if you want one. Put a display on the signal — a metric, a gauge, a chart — and every value the device writes shows up there. Change the display, the device does not change.
The device knows nothing about widgets. It writes a number to I1. What I1 looks like is your call, on the phone, and you can change your mind any time.
Before you start. Make sure your sketch can read the sensor on its own: print the value to the Serial Monitor first. If the value is wrong there, it will be wrong on the phone too.
1. Declare the signal
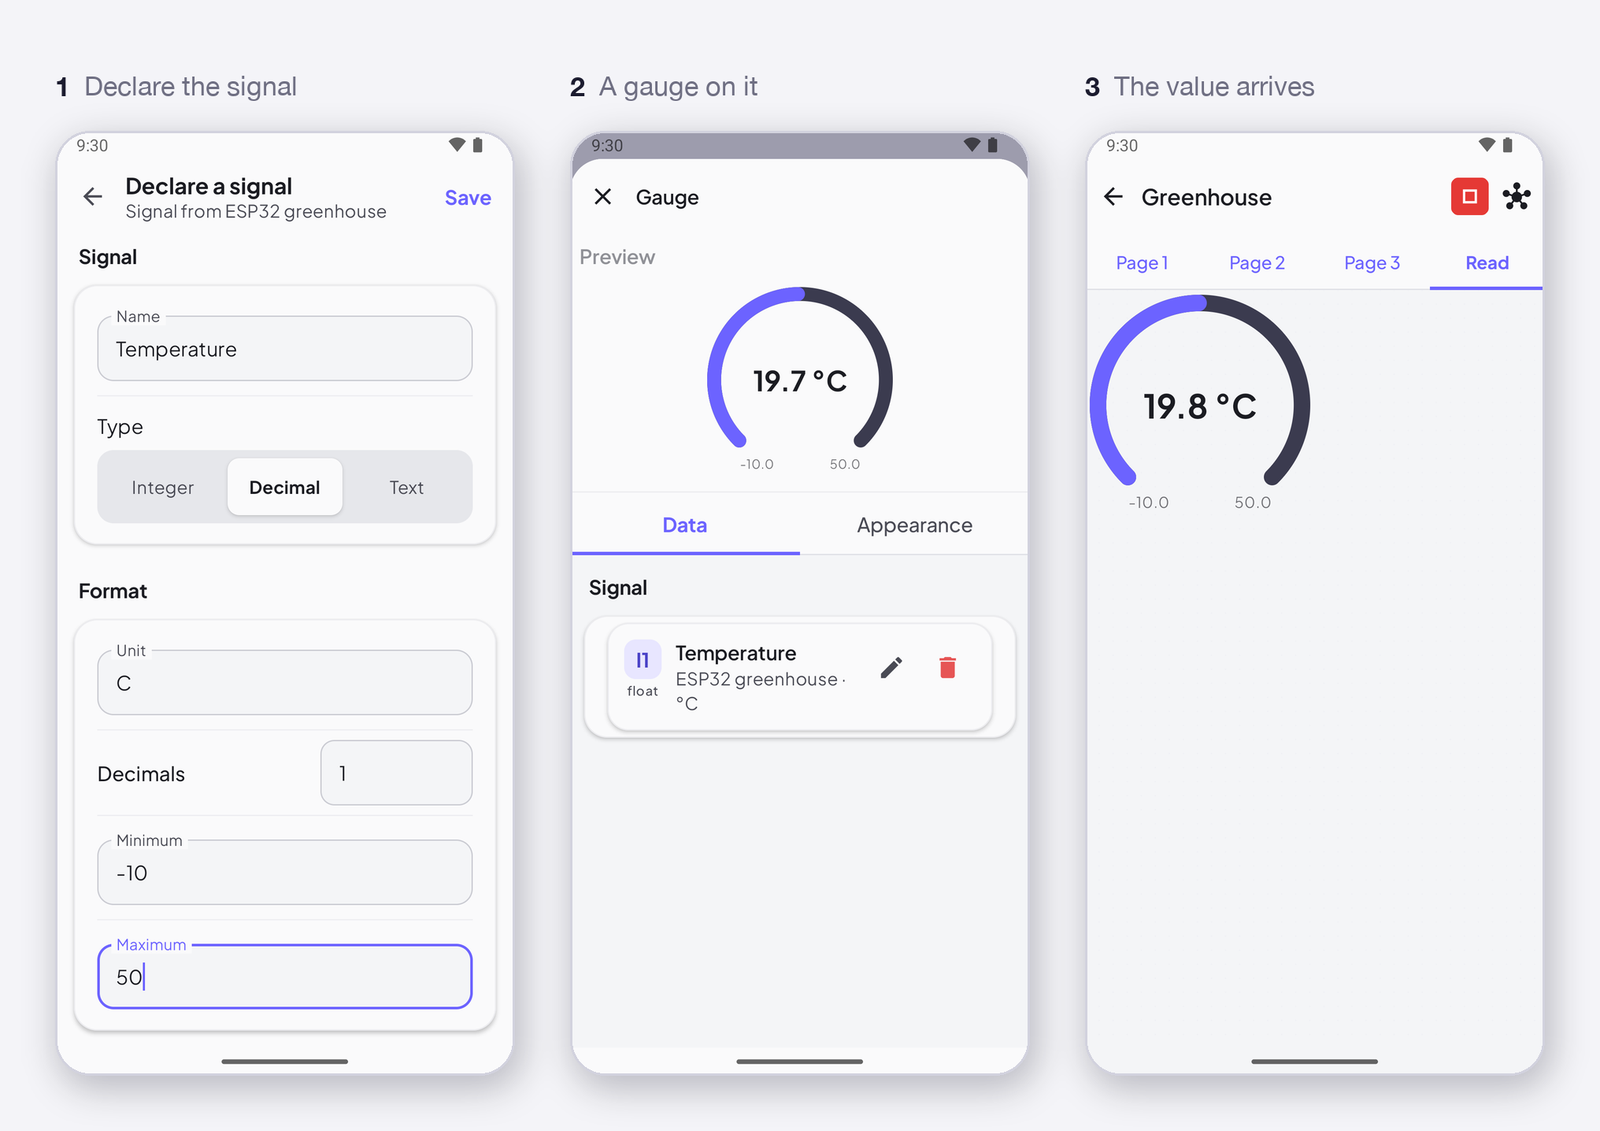
Tap the device icon at the top right of your dashboard, then Declare a signal. Name it Temperature, choose the type Decimal, give it the unit °C, a minimum of -10 and a maximum of 50. Under Advanced, choose Curves if you want a chart. The app gives it the next free address — I1.
2. Put a display on it
Tap + at the bottom of the dashboard and choose Gauge under Displays — or a Metric, or an Advanced Chart. Tap the gauge, open its Data tab, tap Pick a signal and choose Temperature. Close the settings: the gauge is on the grid, waiting for its first value.
3. Write the value from the device
One line in the sketch, wherever you read the sensor:
InstantIoT.write(I1, readTemperature());
I1 is the address the app gave the signal, and float is what a Decimal signal takes — Integer would take an int, Text a const char*. readTemperature() is yours, whatever your sensor needs; an LM35 on A0, no library to install:
float readTemperature() {
    return analogRead(A0) * 3.3 / 4095.0 * 100.0;   // 10 mV per °C; 5.0 / 1023.0 on a 5 V board
}
The complete sketch, publishing once a second:
#include <InstantIoT.h>

const char* WIFI_SSID    = "MyWiFi";
const char* WIFI_PASS    = "MyPassword";
const char* DEVICE_TOKEN = "PASTE_TOKEN_HERE";

InstantTimer timers;

void publish() {
    InstantIoT.write(I1, readTemperature());   // a Decimal signal, unit °C
}

void setup() {
    InstantIoT.begin(WiFiLink(WIFI_SSID, WIFI_PASS), Cloud(DEVICE_TOKEN));
    timers.every(1000, publish);
}

void loop() {
    InstantIoT.loop();
    timers.run();
}
On the timer, once a second — not in
loop().timers.every(1000, publish)is the whole pacing: nodelay(), which would stop the library reading the app, and nowrite()on every pass ofloop(), which would send tens of frames a second all day. A sensor does not change ten thousand times a second, and on the Cloud every frame is a point in your history and a share of your plan. Slow things get a slower timer —timers.every(60000, publish)for a tank level.
What you get for free
- The same value, several ways. A metric and a chart on the same
I1show the same reading. One signal, as many displays as you like — and still the one lineInstantIoT.write(I1, readTemperature());in the sketch, nothing to add. - A history. With Curves, the chart shows the last hour, day or week — kept 1 week on Free, 3 months on Maker.
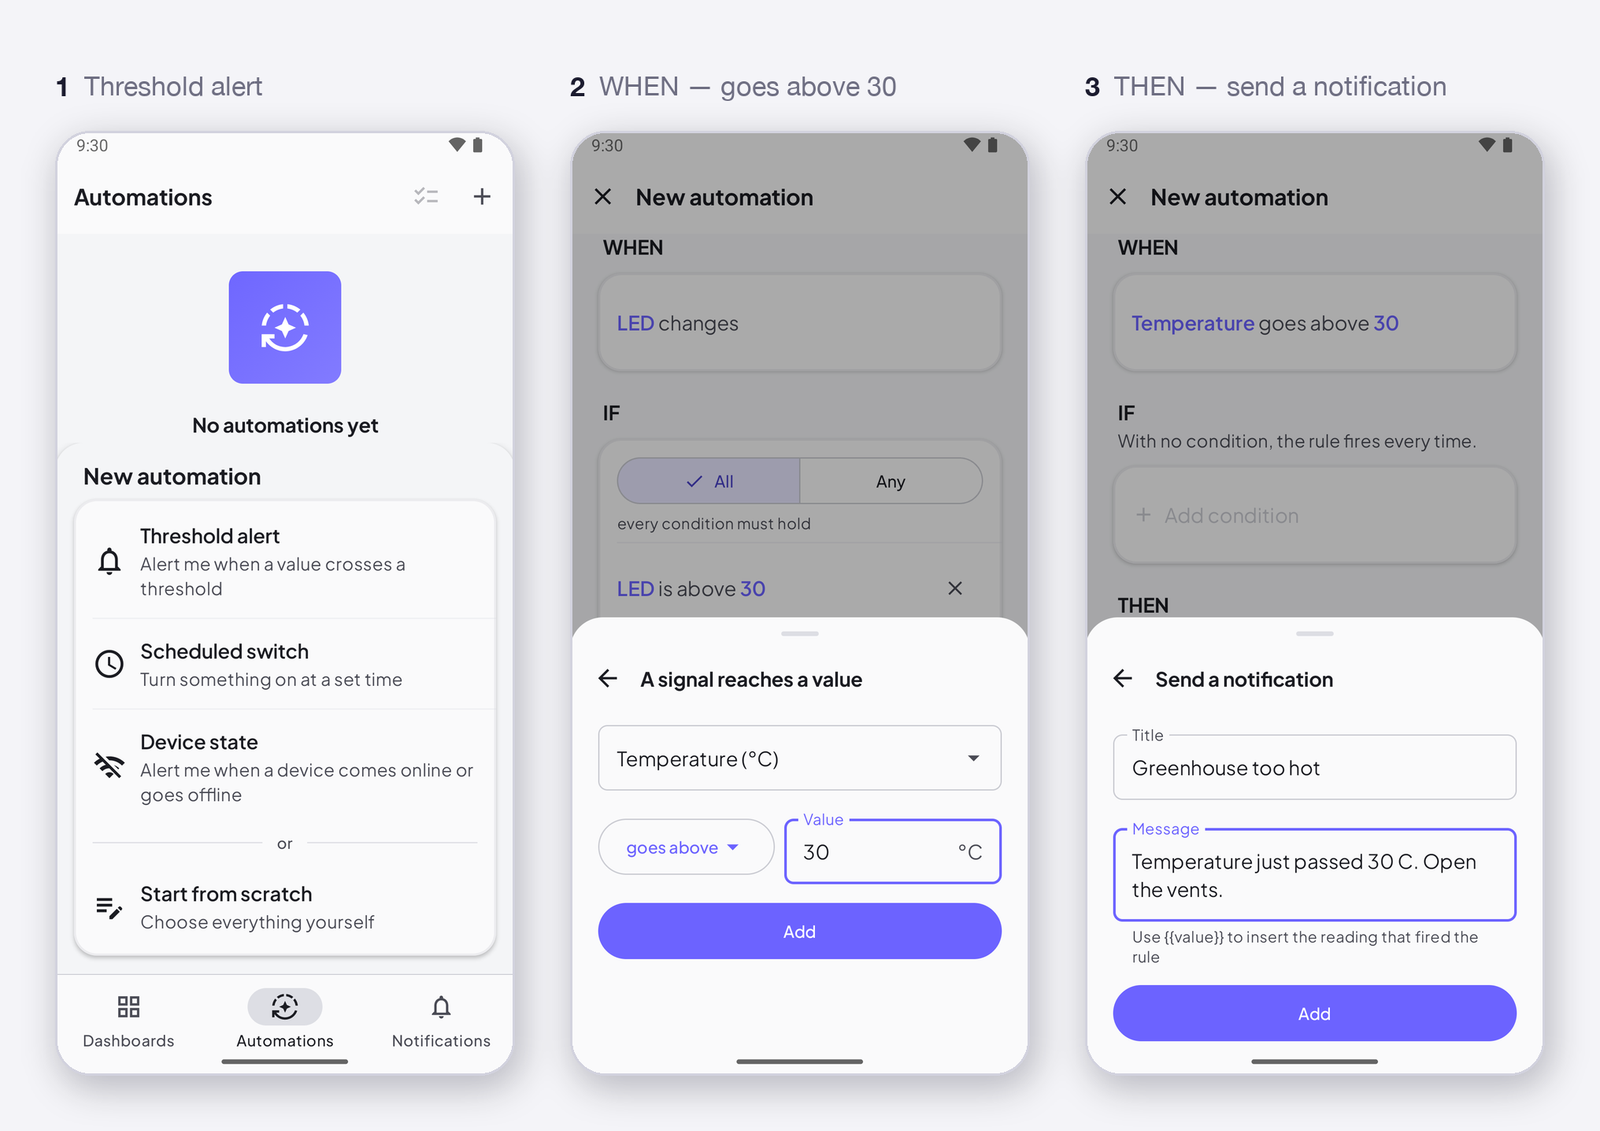
- A trigger. When Temperature goes above 30, notify me — that is Get notified when a value crosses a threshold, three taps away.
Where next
- Control your device from your phone — the other direction.
- Send values from the device to the app — every type, and what
falsemeans. - Signals: types, format and history — what a signal is made of.